|
Role of Geomatics in Earthquake Mitigation N atural disasters like cyclone, flood, drought, landslide, earthquake (Tsunamis)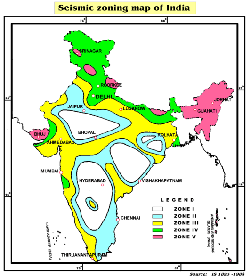 etc. have devastating effect on life and property. Earthquakes are
short-lived, menacing and the most feared natural hazards because of
their sudden impact and devastation in a matter of few seconds,
inflicting immense loss to life and property.
etc. have devastating effect on life and property. Earthquakes are
short-lived, menacing and the most feared natural hazards because of
their sudden impact and devastation in a matter of few seconds,
inflicting immense loss to life and property.
Crustal deformation is, in fact, a direct manifestation of the process that leads to earthquakes. Though areas prone to seismic hazards are fairly well known, there has been very little advance in our ability to predict when, where, or with what magnitude will the next earthquake strike. Since we are not in a position to predict an earthquake, we must at least try to find out the scientific causes that can lead to such catastrophic earthquakes. For this, the study of neotectonics and geology of a particular region is very important. The major thrust is to arrive at a probabilistic zoning map of the study area, based on the basis of these scientific findings and incorporate all relevant details related to damage assessment, rescue and relief operations. Geomatics is a recently emerging technology, which can play a vital role in the mitigation of natural disasters. Geomatics is a conglomerate of measuring, mapping, geodesy, satellite positioning (GPS), photogrammetry, computer systems and computer graphics, remote sensing, Geographic Information Systems (GIS) and environmental visualization. The Earth Observation Satellites provide a comprehensive, synoptic and multi-temporal coverage of large areas for a wide range of scales, from entire continents to minute details of a few metres in real time and at frequent intervals and thus, have become valuable for continuous monitoring of Earth and its atmosphere (Roy et al., 2000). Remote sensing and GIS based change detection technique is used to assess earthquake induced damages to houses and other structures accurately and speedily as this technique is cost effective, unbiased, and free from subjectivity. This technique not only saves time, but also provides quantitative damage assessment. Geomatics in Tectonic Study Lineaments and faults are the sources of neotectonic activities, which may often lead to an increase in seismic hazards of the region. LISS-III and panchromatic (PAN) merged images can be used to delineate vertical to high angle faults or suspected faults. All lineaments mapped from enhanced False Colour Composite (FCC) and edge enhancement images can be merged to bring out the total lineament map of the area. The drainage pattern is an excellent indicator of not only the surficial lithology and the geological structures but also the ongoing morphotectonic processes of the planet Earth. Among the various drainage patterns, the ‘eyed drainage’ pattern is considered to be one of the most significant anomalies and such mega-eyed drainage signifies the ongoing tectonic movements (Ramasamy et.al., 2000). IRS-1A and IRS-1C FCC imagery (using blue, green and red colours in spectral ranges) can be interpreted with a specific look to bring out the eyed drainages. Synthetic Aperture Radar (SAR) i.e. Space-borne interferometry, which gives high-resolution imagery of earthquake prone areas, accompanied by GPS survey provides an ability to identify subtle changes on the Earth’s crust (Lunetta and Elvidge, 1999) and identification of non-homogenous surface deformation (co-seismic deformation). The Earthquake induced damage can occur due to liquefaction and or related phenomena, landslides, ground motion, tsunamis, ground rupture and tectonic subsidence or uplift. Geomatics in Seismic Zoning Seismic Zoning can be defined as delineation of geographic areas with varied potentials for surface faulting, ground shaking, liquefaction and landsliding during future earthquakes of specific size and location (Berlin, 1980). While seismic zoning takes into account the distribution of seismic hazard over the entire country or region, seismic micro-zonation takes into account the effect of local site conditions i.e. the detailed distribution of earthquake risk within each seismic zone. For seismic micro-zoning, all data related to geology, ground acceleration, historical earthquake and remote sensing derived parameters are incorporated into a common spatial database and then analyzed to get the Hazard Map. Micro-zonation study has been carried out in various earthquake-prone parts of the world including Memphis, Mexico, British Columbia, Puerto-Rico, City of Basel etc. Geomatics in Damage Assessment Disaster management consists of two main phases—disaster prevention and disaster preparedness (disaster relief, rehabilitation and reconstruction). In the disaster prevention phase, GIS is used to manage the large volume of data needed for the hazard and risk assessment. In the disaster preparedness phase, it is a tool for the planning of evacuation routes, for the design of centres for emergency operations, and for integration of satellite data with other relevant data in the design of disaster warning systems. High-resolution satellite imagery offers new possibilities for the earthquake damage assessment and thus a multidisciplinary approach combining remote sensing techniques, spatial analysis and earthquake engineering can provide fast loss estimation. The information can be integrated into a GIS database and transferred via satellite networks or Internet to the rescue teams deployed in the affected zone. The results of a fast damage assessment received by the field operators could help the civil protection in order to co-ordinate the emergency operations (Chiroiu et al., 2001). Another disaster-based tool used in pre-disaster management is Vulnerability Mapping, which helps in the possible mapping of liquefaction prone areas. Successful uses of remote sensing data have been made for damage assessment of the Bhuj earthquake using Landsat-7 Satellite images (Yusuf et.al., 2001). Even assessment or mapping of damages to homes and ground in water-affected regions during the Bhuj quake using IRS-1C & 1D (PAN and LISS-III) pre-and post-earthquake datasets have also been attempted. Conclusion Geomatics has a potential use in various aspects of earthquake related studies such as active tectonics, hazard zonation and damage assessment and can even act as possible precursors for earthquake. SRTM data, multi-spectral data, SAR data, IRS stereo data and aerial photos, allow us to map terrain properties, such as crustal deformation, thermal anomaly, geology etc, both temporally and spatially. SAR interferometry and GPS survey are the only avenues for mapping of deformation. High-resolution satellite data can be used in real-time damage assessment. GIS is a key for spatio-temporal analysis of earthquake data for hazard zonation and damage assessment. Remote Sensing and GIS provide a platform for gathering and organizing the information and have proved their usefulness in disaster management. Thus, geomatics can play a vital role in mitigation of natural hazards. q
Reference Geomatics in Earthquake Mitigation Ramanuj Banerjee, Devendra Kumar, K. K. Mohanty and Shailesh Nayak , Space Applications Centre (ISRO), www.gsi.gov.in/ zonation.htm
|