The 
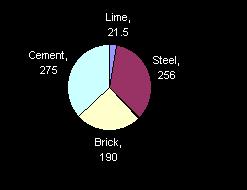
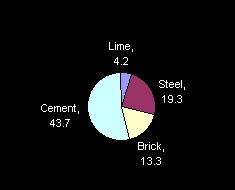
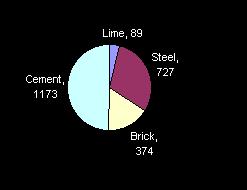
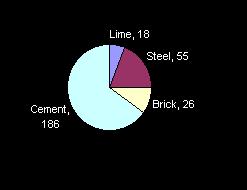
Construction Sector in India and Climate Change

The construction sector in India emits about 22% of the total annual emission of CO2 resulting from the Indian economy.  Of the emissions from the construction sector, 80% are resulting mainly from the products/industrial processes of four energy intensive building materials:

  *     Steel

  *     Cement

  *     Bricks

  *     Lime

For each of the four building materials, there exists a technology spread characterised by widely varying levels of energy and material consumption within each sector.  The total energy and emissions for 1989-90 for these four building materials are 742.5 peta joules and 80.5 million tones of CO2.  The energy and emission levels were arrived at as a function of technology and scale of production (Table 1).

A study conducted by Development Alternatives discussed the increasing demand for building materials in the construction sector as a direct outcome of the galloping demand for housing on a continuing growth trend of 2.4% per annum aggregate cumulative growth rate.  The housing gap which is currently 30.8 million houses will be steadily cleared by the year 2011 AD.  Housing will finally be provided to the entire population estimated to be 1308 million according to the low growth scenario in 2020 AD. 

The nature of building materials used in housing has been taken to be 75% of the permanent type as per trends upto 1991.  Beyond 2001, the growth rate has been revised downwards to conform to the population growth rate.  The housing gap is likely to be closed by 2011 if the projected trend persists.

The summary of the total energy and emissions for the four materials derived through the Developmen Alternatives study has been presented in Table 2.

The energy and emissions upto 2020 have been computed using specific energy consumption and carbon emission factor.  Although steel and cement together constitute more than two-thirds of the net contribution, these are sectors that are showing positive signs of adopting energy efficiency measures.


Future Scenario

At Table 3 on Page 4, energy consumption per tonne of material (1000 bricks in case of bricks) and the emission for different levels of technologies, viz, business-as-usual, best practice and new technologies show the mitigating impact that best practice and new technologies can make on the climate change causative factors.  Going by `business-as-usual`, the energy need for 2020 AD works out to 2363 PJ for the construction sector.  If the `best practice’ route is followed, a 17% reduction is possible and if new technologies are adopted, a reduction of 25% in energy consumption is achievable.

Table 1: Total energy and emissions for cement, steel, brick and lime (1989-90)

Material

Production

Energy

PJ

            CO2 Emissions (106)

                      tCO2                                 tC

Cement

47.53 x 10⁶t

275.0

43.7

11.92

Steel

08.09 x 10⁶t

256.0

19.3

5.26

Bricks

45.31 x 10⁹ nos.

190.0

13.3

3.63

Lime

03.30 x 10⁶t

21.5

4.2

1.15


Table 2:  Projections upto 2000

Material Demand, Energy and Emission


Material Quantity

Energy PJ

Emission mt CO2

Year

2000

2010

2020

2000

2010

2020

2000

2010

2020

Steel (in mt)

9.6

14.9

23.0

303.4

469.9

726.8

23.0

35.0

55.2

Cement (in mt)

92.5

136.0

202.0

535.8

787.7

1173.1

85.1

125.2

186.2

Bricks (in billion)

61.2

72.9

89.1

257.0

306.2

374.2

17.7

21.1

25.8

Lime (in mt)

5.1

8.3

13.6

33.3

51.2

88.4

6.7

10.8

17.7

Total Energy & Emission

2262.5

284.9


Figure 1 : Total Energy and Emissions : a summary 1990
 

Total Energy = 742.5 PJ

Total Emission  = 80.5 mt CO2

   
Figure 2 : Total Energy and Emissions : a summary 2020
 
Total Energy = 2363 PJ Total Emission = 285 mt CO2


Table 3 : Different Levels of Technology

  Technology as usual Best Practice New Technology
 

Steel Production

Description Mini : Scrap based Mini: Mixed feed 75% scrap, 30% sponge, non-cooking coal based Mini: Mixed feed, 70% scrap, 30% sponge iron, natural gas based
  ISP : Open Hearth, LD Concast ISP : thin slab continuous casting, coal injection ISP : Corex process, utilising non-coking coal
Energy* 31.6 GJ/t 24.75 GJ/t 21.7 GJ/t
Emissions 2.4 t CO2/t 1.82 t CO2/t 1.2 t CO2/t
* Energy figure is based on possible mix of technologies for different scales of production.


Cement Production

Description Dry process = 75%
Semi dry = retrofitting wet
Wet process being phased out
Gujarat Ambuja; Dry process with 5 stage pre-heater Improved dry process at Japanese levels of technology
Energy* 5.79 GJ/t 5.34 GJ/t 4.5 GJ/t
Emissions 0.92 t CO2/t 0.894 t CO2/t 0.835 t CO2/t
* Energy figure is based on possible mix of technologies for different scales of production.


Brick Production

Description Bull's Trench Kiln with Movable Chimney : 90% Fixed Chimney: 10% Bull's Trench Kiln with Fixed Chimney High Drought Kiln and Vertical Shaft Brik Kiln
Energy * 4.2 GJ/'000 bricks 3.2 GJ/'000 bricks 2.6 GJ/'000 bricks
Emissions 0.29 t CO2/'000 bricks 0.23 t CO2/'000 bricks 0.18 t CO2/'000 bricks
* Energy figure is based on possible mix of technologies for different scales of production.


Lime Production

Description Kiln : Traditional VSK for building lime with Movable Chimney : 90% Fixed Chimney: 10% Kiln : Improved VSK KVIC, CBRI design exists for Chemical Lime Kiln : Parallel flow regenerate type
Energy * 6.5 GJ/tonne 5.5 GJ/tonne 4.6 GJ/tonne
Emissions 1.3  t CO2/t 1.03 t CO2/t 0.97 t CO2/t
* Energy figure is based on possible mix of technologies for different scales of production.

Shelter is a basic need and is high on India’s national priority. The Construction Sector stands out as one of the areas for North/South collaboration at the industry level in the interest of abatement of global warming.

Source : "Case Study for Construction in India" - by Development Alternatives in "Structural Transformation Process towards Sustainable Development in India and Switzerland" - published by INFRAS publication, Zurich. q

Back to Contents

 
    Donation Home

Contact Us

About Us