|
Decomposition of aggregate energy intensity index allows the change in energy demand to be better understood for energy and environmental policy formulation. In India during 1989-90 to 1997-98 structural changes have pushed up the energy intensity index while conservation measures pulled it down after 1995-96.
I
ndia is the second largest commercial energy consumer in Non-OECD East Asia, comprising 19 percent of the region’s total primary energy consumption. Economic growth in India has largely been associated with increased energy consumption. While 60% of total energy needs in India are met by commercial energy sources, remaining 40% are comprised of non-conventional fuels. Over past few years, climate change has become one of the main concerns driving energy policy. More than 150 countries, including India, have committed themselves under the United Nations Framework Convention on Climate Change to formulate and implement mitigation and adaptation measures to climate change. India accounts for over 3.5% of world carbon emissions. Since energy use is a major source of emissions, it is necessary to focus on the management of energy demand and supply as a means to abatement. While energy demand grows significantly with economic growth, this coupling varies over time, depending on various other things. Technological progress, energy efficiency programmes and structural changes contribute towards the variation in energy demand. Understanding the various components of energy demand is therefore important and necessary in order to deal with future emissions.
Energy use profile of the Indian economy
Sectoral demand for energy arises mainly from lighting and cooking in the household sector; irrigation and other operations in the agricultural sector; transport of passengers and freight and fuel input requirements in the industrial sector. Table 1 shows sector-wise activity level and energy consumption pattern in India. India’s commercial energy consumption has increased from 130.7 million tonnes of oil equivalent (mtoe) in 1991/92 to 176.08 mtoe in 1997/98. Per capita commercial energy consumption increased from 152.7 kilo grams of oil equivalent (kgoe) to 184.7 kgoe over the same period. Average annual growth rate for the agricultural GDP is 2.6 percent, the same figures for the industrial, transport and the service sectors are 6.8 percent, 7.6 percent and 6.4 percent respectively. Industrial sector has consistently remained the largest consumer of commercial energy, followed by the transport sector despite declining share of industrial sector from 50.4 percent in 1991-92 to 47.8 percent in 1997-98.
Indicator analysis
Energy use can be viewed as a function of total GDP, structure of the economy and technology. Aggregate energy intensity is taken as an energy performance indicator in energy demand analysis. Literature on indicator analysis adopts either of the two approaches: energy consumption approach or energy intensity approach. We follow the intensity approach and decompose total energy-GDP ratio into structural effect (S.E) and intensity effect (I.E). Structural effect shows that part of change in energy use which is attributable to change in activity composition of an economy. Intensity effect tells us that keeping GDP effect and structural effect unchanged, what has been the change in energy use solely due to conservation measures. Figure 1 and accompanying table show the respective values for the structural effect (Dstr), intensity effect (Dint) and the total effect (Dtot) comprising of these two effects. In last decade, India experienced a structural change that has worsened the overall energy intensity index as it is greater than one except in two intermediate years of 1992-’94. Beyond 1993-94 the structural effect shows a rising trend in energy intensity. Intensity effect showing the conservation effort had a fluctuating trend, though this effect alone could outweigh the structural effect and overall energy intensity index shows falling trend after 1995-96.
|
Table 1: GDP at constant prices (Rs Th crores) and energy consumption (mtoe) in India |
||||||||
| Years |
Agriculture GDP |
Energy consumed in agriculture |
Industry GDP |
Energy consumed in industry |
Transport and trade GDP |
Energy consumed in transport |
Services GDP |
Energy consumed in services |
| 1989-90 |
63.3 |
4.3 |
50.6 |
60.5 |
35.9 |
27.8 |
51.7 |
15.8 |
| 1990-91 |
65.7 |
4.9 |
53.9 |
62.9 |
37.7 |
28.0 |
55.0 |
16.5 |
| 1991-92 |
64.1 |
5.6 |
52.8 |
65.9 |
38.6 |
29.3 |
58.4 |
17.1 |
| 1992-93 |
68.0 |
6.1 |
55.1 |
68.5 |
41.0 |
30.6 |
61.1 |
17.8 |
| 1993-94 |
70.5 |
6.8 |
59.3 |
71.0 |
44.0 |
31.6 |
65.3 |
18.7 |
| 1994-95 | 74.1 | 7.7 | 66.0 | 73.9 | 48.7 | 33.4 | 68.9 | 20.0 |
| 1995-96 |
71.9 |
8.44 |
74.5 |
87.0 |
55.2 |
45.3 |
74.5 |
21.8 |
| 1996-97 | 77.6 |
8.34 |
79.4 |
92.3 |
60.0 |
42.1 |
79.9 |
18.8 |
| 1997-98 |
76.4 |
8.71 |
84.0 |
77.5 |
63.1 |
47.6 |
88.4 |
27.6 |
Source: Reserve Bank of India, 1999 and Tata Energy Research Institute (various issues).
Sectoral Energy Intensities
Structural effect is dominated by sharp increase in the in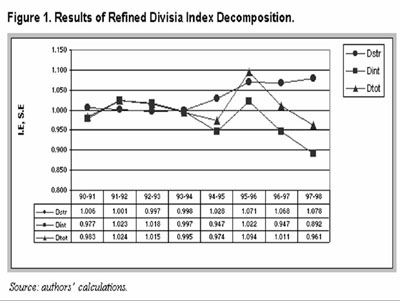 dustrial
and transport sector GDP. Figure 2 shows that energy intensity is higher
in the industrial sector, followed by the transport sector. But, the
industrial sector records a downward trend in energy intensity. The
average annual decline in energy intensity during 1989-90 to 1997-98 is
2.14 per cent as compared to 0.33 per cent in the transport sector and
1.08 per cent in the service sector. On the other hand, agriculture sector
records an increase in the energy intensity over the same period (6.5 per
cent). But, there seems to be significant energy efficiency improvements
to curb the rising structural effect, and as a result of which the
aggregate energy intensity index of the economy has improved after
1995-96. This can be traced to demographic changes, including relatively
faster growth in urban areas, high per capita GDP, penetration of more end
use devices, technological improvements in conversion equipment and
inter-fuel substitution with more efficient alternatives in the energy
intensive industries.
dustrial
and transport sector GDP. Figure 2 shows that energy intensity is higher
in the industrial sector, followed by the transport sector. But, the
industrial sector records a downward trend in energy intensity. The
average annual decline in energy intensity during 1989-90 to 1997-98 is
2.14 per cent as compared to 0.33 per cent in the transport sector and
1.08 per cent in the service sector. On the other hand, agriculture sector
records an increase in the energy intensity over the same period (6.5 per
cent). But, there seems to be significant energy efficiency improvements
to curb the rising structural effect, and as a result of which the
aggregate energy intensity index of the economy has improved after
1995-96. This can be traced to demographic changes, including relatively
faster growth in urban areas, high per capita GDP, penetration of more end
use devices, technological improvements in conversion equipment and
inter-fuel substitution with more efficient alternatives in the energy
intensive industries.
Since sectoral output growth is the main contributing factor to rising
energy intensity, one might think that policies should be designed to curb
this growth. However, this would mean imposition of real cost on the
economy. Hence, policy alternatives should see how to offset this
increasing output effect by negative intensity and structural effects.
Declining structural effect can be achieved by a greater shift towards
non-energy intensive industries, expansion of service sector etc. Negative
trend in intensity effects can be intensified by inter-fuel substitution,
introducing efficient technology to improve energy productivity. Other
country studies reveal one thing in common that in most of the OECD
countries energy intensity declined and improved energy efficiency played
a substantial role in it. Intensity effect is smaller for India than for
other countries. Energy demand can be restricted directly through economic
instruments like prices, taxes or rationing etc. But they have their
adverse welfare impact also unless supplemented by indirect policies in t he
form of introduction of more efficient technologies. Conservation in
industry sector has been successful in putting a break to rising overall
intensity trend. Energy efficiency improvement through R&D, labels and
standards, technology transfer may be a better policy tool to strengthen
conservation effect to offset rising energy intensity due to structural
change and activity growth.
he
form of introduction of more efficient technologies. Conservation in
industry sector has been successful in putting a break to rising overall
intensity trend. Energy efficiency improvement through R&D, labels and
standards, technology transfer may be a better policy tool to strengthen
conservation effect to offset rising energy intensity due to structural
change and activity growth.
Economic growth and structural change are the big drivers in positive growth in energy intensity in India. The structural component is driven mainly by incomes and by forces not directly related to energy or energy policies. Since it is difficult to restrict energy demand rising from increased output or activity directly, stress needs to be on conservation measures at the early stage of development. Sectoral policies on housing, commercial buildings, industry and transport must integrate energy efficiency at local, regional and national levels.
qThe Authors — Mitali Das Gupta
(Research Scholar) &
Joyashree Roy (Professor of Economics)
are with the Department of Economics, Jadavpur University, Kolkata
|
Forests — Our Carbon Sinks! |
|
Forest vegetation and soils hold almost 40 percent of all carbon stored in terrestrial ecosystems. Forest regrowth in the northern hemisphere absorbs carbon dioxide from the atmosphere, currently creating a "net sink" whereby absorption rates exceed respiration rates. In the tropics, however, forest clearance and degradation are together a net source of carbon emissions. Expected growth in plantation area will absorb more carbon, but likely continuation of current deforestation rates will mean that the world's forests remain a net source of carbon dioxide emissions and a contributor to global climate change. |